
Introduction
In the fast-paced world of trading, Initial Public Offerings (IPOs) are a beacon of opportunity for investors seeking to get in on the ground floor of promising companies. But what is an IPO? An IPO marks the transition of a privately-held company into a publicly-traded one, allowing it to raise capital by offering shares to the public. The excitement surrounding IPOs can be exhilarating, yet the intricacies of IPO trading demand a well-informed approach. As traders navigate this terrain, one invaluable tool that complements their decision-making process is technical analysis. Let’s delve into how technical analysis techniques can empower IPO traders to make strategic moves and optimize their trading outcomes.
Overview of How Technical Analysis Complements Fundamental Analysis
While fundamental analysis dives deep into a company’s financial health, growth prospects, and management team, technical analysis focuses on price patterns, trends, and market sentiment. It is the art of studying historical price data and market activity to forecast future price movements. What makes technical analysis particularly relevant for IPO traders is its ability to provide insights into short-term price fluctuations, offering a tactical advantage in a volatile IPO trading platform.
Key Concepts: Price Charts, Trends, Support, and Resistance Levels
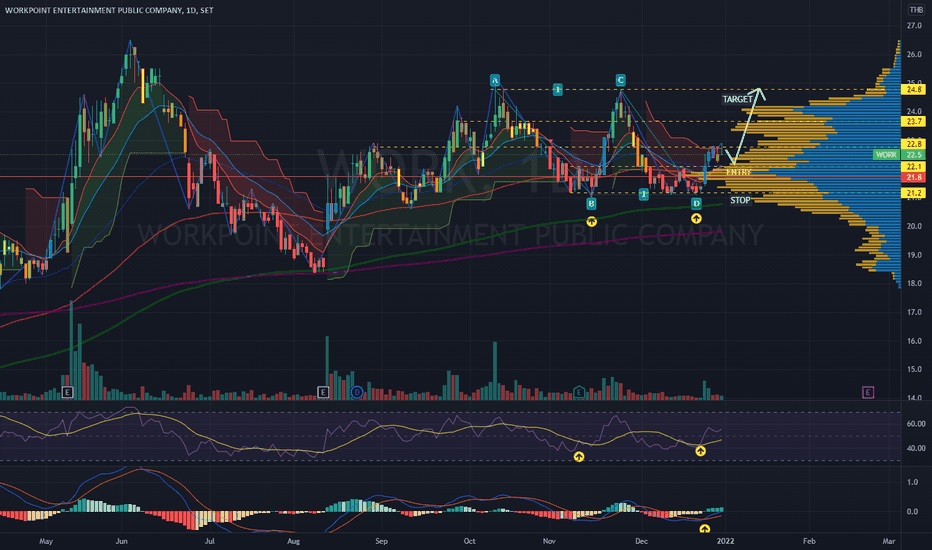
At the heart of technical analysis lies the interpretation of price charts. Traders examine price movements over specific time frames to identify patterns and trends. These trends can be upward (bullish) or downward (bearish), and recognizing them is crucial for making informed trading decisions. Additionally, technical analysts use support and resistance levels to pinpoint potential entry and exit points. Support represents a price level where a stock tends to stop falling and may even rebound, while resistance is the level at which a stock often stops rising. These key concepts help traders time their entries and exit more effectively.
Introduction to Technical Indicators and Oscillators
Technical analysis employs an array of tools known as indicators and oscillators to refine trading decisions. Indicators, such as Moving Averages and Relative Strength Index (RSI), offer insights into price trends and momentum. RSI, on the other hand, gauges the magnitude of recent price changes to evaluate overbought or oversold conditions. These tools provide invaluable signals that assist traders in navigating the complexities of IPO trading.
Identifying Common Price Patterns in IPOs
IPO trading often presents unique price patterns that can be deciphered through technical analysis. Traders frequently encounter patterns like symmetrical triangles, cup and handle formations, and head and shoulders patterns. These patterns are visual representations of investor sentiment and can signal potential future price movements. By recognizing and interpreting these patterns, traders can position themselves advantageously in the IPO market.
Explanation of Moving Averages and Their Significance
Moving Averages (MAs) are fundamental tools for IPO traders. These indicators smooth out price data, revealing the underlying trend over a specific period. MAs not only help traders identify trends but also serve as dynamic support and resistance levels. Crossovers between short-term and long-term MAs often signal shifts in momentum and potential trade opportunities.
Importance of Identifying Trends in IPO Trading
Trend analysis is a cornerstone of technical analysis and holds particular significance for IPO traders. Understanding the direction and strength of trends allows traders to align their strategies with the prevailing market sentiment. Drawing trendlines enhances trend identification and helps traders anticipate potential turning points, assisting in making well-timed trading decisions.
Explanation of Momentum Indicators and Their Role
Momentum indicators shed light on the speed and strength of price movements, aiding IPO traders in assessing potential trend reversals. The Relative Strength Index (RSI) is a popular momentum indicator for determining the size of recent price moves. By indicating overbought or oversold conditions, RSI assists traders in timing their entries and exits more effectively.
Significance of Trading Volume in Technical Analysis
When price changes are accompanied by high volume, it suggests strong market participation and validates the trend. Conversely, low volume during price changes may indicate weak momentum or potential reversals. Volume analysis helps IPO traders validate price trends and anticipate potential market shifts.
Recognizing Chart Patterns Such as Triangles, Flags, and Pennants
Chart patterns are visual representations of market sentiment and price behavior. IPO traders often encounter patterns like triangles, flags, and pennants. Triangles signal potential price continuation or reversal, flags represent brief pauses within a strong trend, and pennants indicate potential explosive price moves. Recognizing and interpreting these patterns equips traders with predictive insights for their IPO trades.
Conclusion
As IPO traders navigate the dynamic and exciting world of initial public offerings, integrating technical analysis techniques becomes a powerful asset. These techniques empower traders to identify price patterns, trends, and momentum, enhancing their decision-making process. Incorporating technical analysis into an IPO trading platform enables traders to tactically time entries and exits, manage risk, and optimize potential returns. So, whether you’re an experienced IPO trader or a newcomer to the IPO landscape, leveraging technical analysis can significantly elevate your trading prowess. As you explore your IPO trading journey, consider utilizing trading apps in India to stay connected, make informed decisions, and seize opportunities in this dynamic market.


Comments